
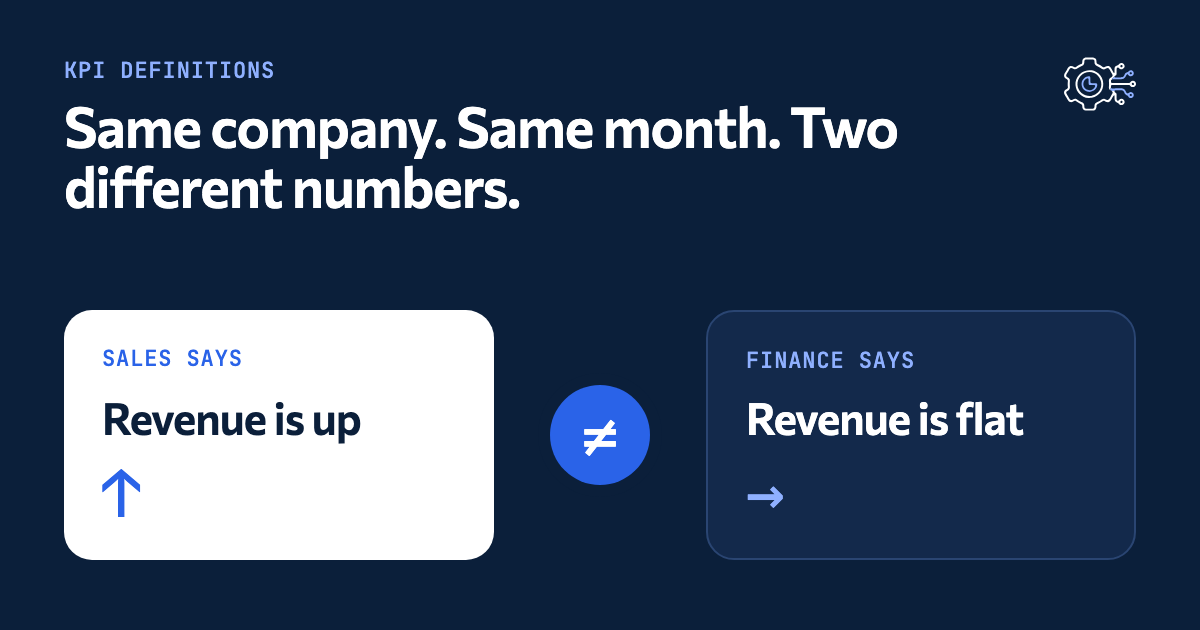
Sales says revenue is up. Finance says it’s flat. Both pulled the numbers correctly.
If you have sat in that meeting, you know what happens next. The first 20 minutes go to working out whose number is right. The decision you came to make waits for next week.
This is not a people problem. Nobody is lying and nobody is careless. It is a definitions problem, and it can be fixed. Here are the five most common causes, what they cost you, and a practical way to agree on one version of the truth.
The symptom: two versions of the same KPI
Two people show up with the same KPI and two different values. Revenue. Margin. Active clients. On-time delivery. Each person can walk you through how they got their number, and each walk-through makes sense.
That is the clue. When both numbers are correct, the difference is not in the arithmetic. It is in what each number means.
Five common causes
1. Different definitions
“Revenue” can mean three different things:
- Booked: the deal is signed.
- Invoiced: the invoice is issued.
- Collected: the money is in the bank.
Sales usually counts booked. Finance usually counts invoiced or collected. In a month with a few large deals, these can move in opposite directions.
Example, travel agency: gross booking value is the total value of trips sold. Net revenue is what the agency keeps after paying suppliers. A trip can raise the first number a lot and the second very little.
2. Different cut-off dates
One team closes the month on the last calendar day. Another closes on the last working day, or when the invoices run. A deal signed on the 31st lands in different months for different people.
3. Different source systems
Sales reads the CRM. Finance reads the accounting system. Operations reads its own tool. Each system is right about what it records. None of them records the same thing.
4. Manual Excel copies and edits
Someone exports a file, fixes a few rows, adds a column and sends it on. A week later there are four versions, and nobody can say which one is current. A single pasted value or a broken formula goes unseen for months.
5. Undocumented exclusions
Are cancellations removed? Are credit notes netted off? Are internal or test orders left out? Each team has made a sensible choice, and nobody wrote it down. So the next person makes a different one.
Example, logistics: on-time delivery can be measured at dispatch (the parcel left on time) or at delivery (the client received it on time). Both are fair measures. They answer different questions, and they give different percentages.
What it costs
You will not find this on a budget line, but you will feel it:
- Meeting time spent reconciling numbers instead of deciding.
- Slower decisions, because nobody wants to act on a figure they might have to defend.
- Lost trust in the numbers. Once people stop believing the dashboard, they go back to their own spreadsheets, and the problem grows.
It also matters for what comes next. If you plan to use AI on your data, it will learn from the same conflicting definitions. Clean definitions are the first step, not an extra.
The fix: one definition, one source, automatic checks
You do not need a big project to start. You need three things.
1. A KPI dictionary. One page that says, for each KPI:
| Field | What to write | Example (illustrative) |
|---|---|---|
| Name | The name everyone uses | Net revenue |
| Definition | One plain sentence | Invoiced sales, minus credit notes, excluding VAT |
| Formula | Exactly how it is calculated | Sum of invoice lines − credit notes |
| Source | The one system it comes from | Accounting system |
| Owner | One named person | Finance lead |
| Refresh | When it updates | Daily, 06:00 |
The owner matters most. When a number is questioned, there is one person who answers.
2. One agreed source. Pick the system that is the source for each KPI, and have every dashboard read from it. No side copies, no pasted tables.
3. Automated checks. Let the system check itself. Do totals match between source and dashboard? Are there duplicates? Did yesterday’s data arrive? A check that runs every morning finds a problem before the Monday meeting does.
Where to start
Do not try to define every number in the company. Start with the five KPIs management uses most. For most SMEs that is some mix of revenue, gross margin, cash, overdue invoices and pipeline.
For each one:
- Put the people who disagree in one room for 30 minutes.
- Agree the definition and write it in the dictionary.
- Name the owner and the source.
- Rebuild the dashboard from that source.
Five KPIs is usually a few weeks of work, not a few months. And the next time sales and finance meet, they look at the same number.
Next step
If your management team keeps debating the numbers instead of using them, we can help. See how we build one source of truth for management KPIs on our executive dashboards page.